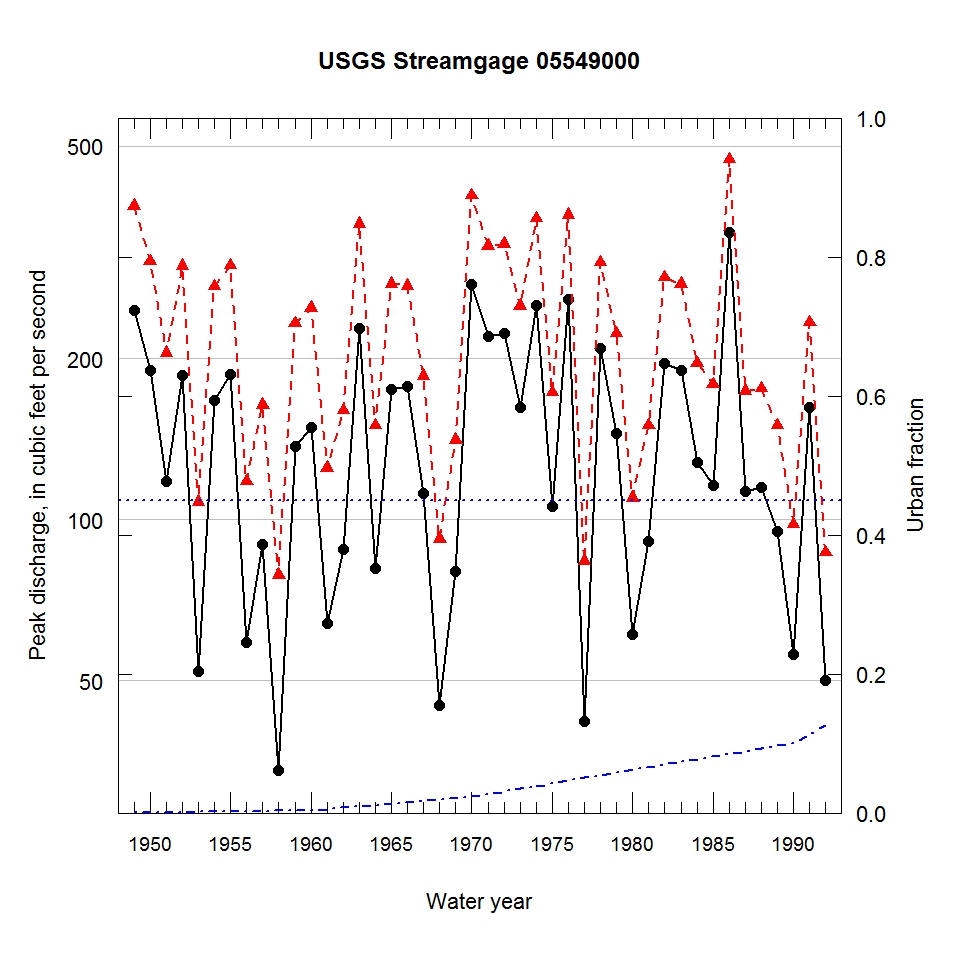
Observed and urbanization-adjusted annual maximum peak discharge and associated urban fraction and precipitation values at USGS streamgage:
05549000 BOONE CREEK NEAR MC HENRY, IL


| Water year | Segment | Discharge code | Cumulative reservoir storage (acre-feet) | Urban fraction | Precipitation (inches) | Observed peak discharge (ft3/s) | Adjusted peak discharge (ft3/s) | Exceedance probability |
| 1949 | 1 | -- | 0 | 0.001 | 0.314 | 246 | 386 | 0.107 |
| 1950 | 1 | -- | 0 | 0.001 | 1.413 | 190 | 304 | 0.218 |
| 1951 | 1 | E | 0 | 0.001 | 2.075 | 118 | 205 | 0.527 |
| 1952 | 1 | -- | 0 | 0.001 | 0.502 | 186 | 298 | 0.231 |
| 1953 | 1 | E | 0 | 0.002 | 0.651 | 52 | 108 | 0.888 |
| 1954 | 1 | E | 0 | 0.002 | 1.417 | 167 | 273 | 0.297 |
| 1955 | 1 | -- | 0 | 0.002 | 0.323 | 187 | 299 | 0.228 |
| 1956 | 1 | E | 0 | 0.003 | 0.414 | 59 | 118 | 0.858 |
| 1957 | 1 | E | 0 | 0.003 | 0.778 | 90 | 164 | 0.696 |
| 1958 | 1 | E | 0 | 0.003 | 0.756 | 34 | 79 | 0.948 |
| 1959 | 1 | E | 0 | 0.004 | 0.433 | 137 | 233 | 0.422 |
| 1960 | 1 | -- | 0 | 0.004 | 0.544 | 149 | 249 | 0.368 |
| 1961 | 1 | E | 0 | 0.006 | 0.979 | 64 | 125 | 0.836 |
| 1962 | 1 | E | 0 | 0.008 | 0.274 | 88 | 160 | 0.711 |
| 1963 | 1 | 3E | 0 | 0.010 | 1.284 | 228 | 357 | 0.141 |
| 1964 | 1 | E | 0 | 0.012 | 1.563 | 81 | 150 | 0.754 |
| 1965 | 0 | 2 | 400 | 0.014 | 0.119 | 175 | 276 | 0.289 |
| 1966 | 2 | D | 400 | 0.016 | 0.510 | 178 | 274 | 0.293 |
| 1967 | 2 | E | 400 | 0.017 | 1.297 | 112 | 186 | 0.611 |
| 1968 | 2 | E | 400 | 0.019 | 1.289 | 45 | 92 | 0.926 |
| 1969 | 2 | 2 | 400 | 0.021 | 1.362 | 80 | 141 | 0.781 |
| 1970 | 2 | -- | 400 | 0.023 | 1.558 | 276 | 404 | 0.092 |
| 1971 | 2 | E | 400 | 0.027 | 0.429 | 220 | 325 | 0.181 |
| 1972 | 2 | -- | 400 | 0.031 | 1.043 | 223 | 328 | 0.177 |
| 1973 | 2 | -- | 400 | 0.035 | 1.556 | 162 | 251 | 0.364 |
| 1974 | 2 | -- | 400 | 0.039 | 1.137 | 252 | 366 | 0.130 |
| 1975 | 2 | -- | 400 | 0.043 | 0.848 | 106 | 173 | 0.658 |
| 1976 | 2 | -- | 400 | 0.047 | 1.462 | 258 | 372 | 0.123 |
| 1977 | 2 | E | 400 | 0.051 | 0.866 | 42 | 84 | 0.939 |
| 1978 | 2 | -- | 400 | 0.055 | 1.524 | 209 | 303 | 0.218 |
| 1979 | 2 | -- | 400 | 0.059 | 0.295 | 145 | 223 | 0.456 |
| 1980 | 2 | E | 400 | 0.062 | 0.884 | 61 | 110 | 0.884 |
| 1981 | 2 | E | 400 | 0.066 | 1.462 | 91 | 150 | 0.754 |
| 1982 | 2 | -- | 400 | 0.070 | 0.291 | 196 | 284 | 0.267 |
| 1983 | 2 | -- | 400 | 0.074 | 1.614 | 190 | 276 | 0.289 |
| 1984 | 2 | -- | 400 | 0.078 | 0.626 | 128 | 196 | 0.566 |
| 1985 | 2 | -- | 400 | 0.082 | 0.531 | 116 | 179 | 0.633 |
| 1986 | 2 | -- | 400 | 0.085 | 1.468 | 345 | 472 | 0.057 |
| 1987 | 2 | -- | 400 | 0.089 | 0.679 | 113 | 174 | 0.653 |
| 1988 | 2 | -- | 400 | 0.093 | 0.913 | 115 | 176 | 0.646 |
| 1989 | 2 | 4B | 400 | 0.097 | 0.119 | 95 | 150 | 0.752 |
| 1990 | 2 | -- | 400 | 0.101 | 0.432 | 56 | 98 | 0.912 |
| 1991 | 2 | -- | 400 | 0.113 | 0.881 | 162 | 234 | 0.420 |
| 1992 | 2 | -- | 400 | 0.125 | 0.967 | 50 | 87 | 0.934 |

